AOE3054 - Appendix 4 - Impact Strength Testing
AOE 3054 Appendix 4 - IMPACT STRENGTH TESTING
Last modified 1 Apr 2025
The following will serve as an introduction into testing plastics using an impact frame whereby a sample is fixed and struck with a hammer swinging in pendulum motion. This is to demonstrate what the instantaneous transfer of force will do to a fixed object. The forces at play here are much larger than necessary to break the object and therefore will only be slightly perturbed by the object resistance to fracture. This small resistance corresponds to the energy absorbed by the object leading to its fracture, also known as fracture energy.
Fracture energy
This test method will be used to determine a plastic specimen resistance to fracture as indicated
by the energy extracted from standardized pendulum-type hammer like the one shown in Figure 1.
This extracted energy or fracture energy Ef, represents the lower limit of energy required
to break the sample of specific dimensions and orientation.
Impact Resistance
While various methods are available to test for impact strength, the Charpy method of determining impact resistance of
notched specimens of plastics (ASTM D6110-10) will be used for this experiment.
The impact frame will record the net energy lost by the hammer through impacting and breaking the sample.
You will use this value to determine the impact resistance. The impact resistance is simply the net energy lost by
the hammer divided by the width of the specimen.
Note that the notch is designed in the specimen to produced
a stress concentration which promotes a brittle, rather than ductile, fracture.
A brittle fracture is instantaneous and thus corresponds to a singular energy value.
The objective of this experiment is to determine the fracture energy of a specimen. The fracture energy testing procedures specified in ASTM D6110-10 will be used. You will test a sample during this experiment with nominal thickness of 3.1mm as shown in Figure 2 and Figure 3.
Each sample contains a notch, or 'printed crack”. This is to direct the stress concentration from the impact of swinging hammer.
The samples will be placed an Instron CEAST 9050 manual impact frame. Detailed directions on how to safely use this machine are provided below in the “Impact Strength Testing Procedures” PDF. After calibrating the frame for the test hammer to be used during this experiment, the manual below describes the procedure to be selected for the sample being evaluated. Once loaded, the screen on the impact frame will notify the user when the hammer is ready to be released. At this point the user will carefully release the hammer and observe breakage of the sample. The follow-through swing of the hammer will rise to an angle that is less than the release angle. This is due to the transfer of energy from the hammer into the fracture of the sample. This resultant angle can be used to determine the loss in energy otherwise known as fracture energy.
An Instron CEAST 9050 manual impact frame will be used to test the samples and is shown in Figure 4. It contains an internal computer which can be accessed and used to run the frame on the touch screen fixed on the bottom-left of the front of the frame. The computer is used to log the test data through predetermined procedures. Control of the machine will be carried out by the user as directed in the procedure PDF.
A non-instrumented Charpy hammer is used to conduct the experiment. The length L of the Charpy hammer from the rotational center to the impact point is 326.8 mm. This hammer dimension is shown in Figure 5.
A mounting anvil, shown in Figure 6, is used to properly position the sample for impact testing. There is a center pin that is used to center the notch in the specimen which is imperative to correctly conduct this test.
The testing machine is a potentially dangerous device and should be treated with great respect. A specially trained operator will be on hand (either your TA or a faculty member) to oversee operation of the machine and give you safety advice. There is a stop button for the hammer. Be sure to properly read the experimental procedures PDF as it contains specific details of how to safely operate the impact frame. Once the specimen is loaded in the machine and the hammer is ready to be release, ensure that the protective door is locked. Once the hammer is released, do not open the door until the hammer has stopped moving. Do not touch any other controls on the machine without express instructions.
You are given specific instructions on how to use the impact frame and computer in the procedure section of this manual.
Don't forget to make a complete list of the apparatus and instrumentation you are using for your logbook.
Just like the fracture toughness testing lab, this experiment has a defined procedure. This is because of the importance (to safety) of using the Instron impact frame correctly and the difficulty of preparing good samples. Ironically this makes it all the more important that you cast a critical eye on the procedure, apparatus and instrumentation you are given. It is all too easy with a set procedure to assume that all the errors have been characterized and sorted out already (they haven't). Therefore preparation of a detailed electronic lab book will be a key component of performing an effective experiment, from deciding (as a group) what the objectives of the lab really are, to recording dimensions and characteristics you are maybe not asked for, and to documenting the apparatus and its flaws through good digital photography. In addition to the apparatus described above you will have at your disposal the (now usual) camera and extra measuring instruments. As always objective observation, as opposed to "matching the theory" is what is being asked.
This entire section should be read before embarking on the experiment. You should also refer to the “Impact Strength Testing Procedures" PDF below that details the proper process for operating the test machine. This will help you identify where information is output and which information is important to your experiment and data collection.
Determining the sample dimensions
The sample shape required to perform a Charpy test is very simple. The samples are rectangular in size (measuring 127mm in legnth and 12.7mm in width) and have a nominal 12.7mm thickness. They feature a 45-degree V-notch with a 2.54mm notch radius.
Mounting the specimen in the testing machine
The sample will be arranged on the mounts using the alignment pin identified in the procedure PDF.
Once set properly and aligned with this pin, the pin will be pulled back to prevent it
from affecting the energy loss in the hammer when it swings through and breaks the sample.
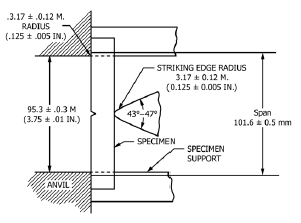
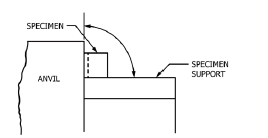
The orientation of the sample with respect to the mounting anvil and the striking edge is shown in Figure 7.
Running the test
Make sure you have opened up the appropriate procedure for each test you conduct.
You will be in an “Operations” window that has signaled the user that the hammer can be released.
Ask your TA to check your setup before beginning the test.
As the test begins, observe the sample breaking and the height to which the follow-through swing rises.
These observations will not affect your calculations,
but are nonetheless valuable things to note in your logbook.
Make sure the protective door is closed (and that everyone is wearing protective goggles) at all times unless you are placing or removing a sample. If this is the case, then the hammer should be in the locked position as designated in the procedure PDF.
(a) Identify the maximum rise angle after fracture
The hammer is initially released from an angle of 150°.
This max rise angle (angle at which the hammer immediately follows-through after impacting the sample)
can be used to calculate the energy lost by the hammer through the process of breaking the sample.
This value can be found in the results window by toggling the last column of results until angle is reached.
(b) Estimating the fracture energy
The hammer will follow a pendulum motion, which is balance of kinetic and potential energy.
By applying a simple conservation of energy between the release point and the point of first reversal (maximum rise), the energy transfered to the sample to produce fracture (i.e. the fracture energy Ef) can be found to be:

The initial potential energy of the hammer E0 (just before it is released) is given by the manufacturer to be 5.40J at an initial release angle θ0 of 150°. The position angle θ is defined positive counterclockwise starting at the impact point (see Figure 4). Using this nomenclature, the maximum rise angle θmr is therefore reported as a negative value. Using the angle you just recorded above, you can now compute the fracture energy Ef using Eq(1).
(c) Comparing the estimated and measured fracture energies
The value calculated in (b) represents an approximation for the energy absorbed by the sample.
A more precise value can be found in the results window. Toggle the last data column until the heading "Energy" is found.
This corresponds to the actual energy lost by the hammer.
Calculate the percent error of your estimation in (b) and compare to the value provided by the test frame computer. Which one is highest? Discuss the possible sources of discrepancy in your logbook (think about what the energy balance in Eq(1) does not take into account). Then compare this value to the energy absorption during the fracture toughness testing of the same sample thickness (12.7mm nominally). Which method did you expect to produce the largest energy absoprtion? Should they be different?
Note that it is typical to report not the absolute energy absorbed (as you just computed) but the impact resistance which is the energy absorbed by the specimen divivded by its width (12.7mm in your case).

Figure 1. Non-instrumented Chapry test hammer

Figure 2. A 3.1mm-thick Charpy test sample before fracture

Figure 3. A 3.1mm-thick Charpy test samples after fracture

Figure 4. Instron CEAST 9050 manual impact frame and coordinate system definition

Figure 5. Non-instrumented Charpy hammer drawing with length dimension shown

Figure 6. Mounting anvil with centering device labeled


Figure 7. Top and side view of mounting anvil


